Over two-thirds of India’s population is exposed to air pollutant levels exceeding 40 μg/m3 (micrograms per cubic metre of air). Thirteen Indian cities have been ranked among the world’s most polluted cities, with an alarming annual mean air pollutant concentration of 74 μg/m3. This has led to eight million annual deaths (20% linked to ambient air pollution), emphasizing severe health risks in urban areas, particularly cardiovascular diseases.
The GEOHealth I aims to:
- Develop a model to estimate ambient exposure to Air Pollution (AP) levels in Chennai and Delhi
- Estimate the association between exposure to AP, temperature, CM risk factors & diseases, and built environment
- Examine DNA methylation patterns associated with AP
- Examine the association between AP & vitamin D levels
Pilot Study
The GEOHealth I Project conducted a pilot study to evaluate personal PM2.5 exposure measurements in the CARRS cohort in Delhi. The study characterized real-time personal exposure of PM2.5 among 100 adults, of varied age and socio-economic groups, residing in Delhi during the summer and winter seasons.
Key Findings
The pilot study findings indicate important seasonal and geographical differences in particulate matter concentrations within Delhi over a significant period, with meteorological and land use features that discriminate most and least polluted regions.
- Overall cross-validated prediction accuracy of the model was 80% over the study period with high spatial model accuracy and predicted annual average concentrations ranging from 87 to 138 μg/m3.
- Annual average root mean squared errors for the ensemble-averaged predictions were in the range 39.7-62.7 μg/m3 with prediction bias ranging between 4.6-11.2 μg/m3.
This exposure assessment can be used to estimate dose-response relationships more accurately over a wide range of particulate matter concentrations.
Air Pollution and Diabetes
- In Delhi and Chennai, among the 10,301 participants, we studied fasting plasma glucose (FPG), glycosylated hemoglobin (HBA1c), incident type 2 diabetes mellitus (T2DM)
- Found stronger effects of increased FPG and HbA1c in Chennai compared to Delhi.
- The risk of developing T2DM was about 22% with longer durations of exposure to PM2.5, and it was the highest risk in Chennai compared to Delhi.
- Stronger effects in study participants with higher body mass index, participants with high blood pressure, and younger age group in Delhi.
The study: PM2.5 exposure, glycemic markers and incidence of type 2 diabetes in two large Indian cities: https://drc.bmj.com/content/11/5/e003333
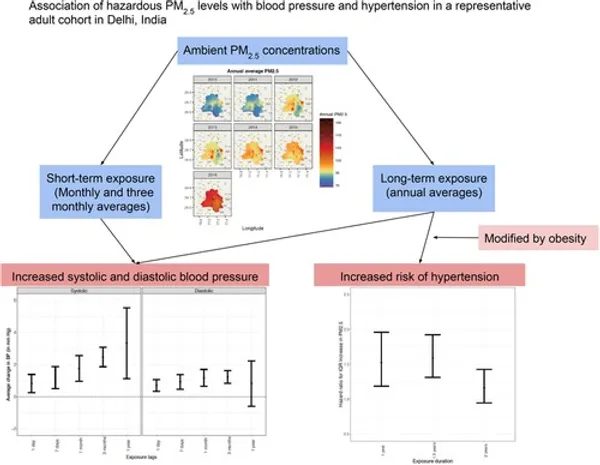
Exposure to Particulate Matter Is Associated With Elevated Blood Pressure and Incident
Hypertension in Urban India
Key findings
- Median annual and monthly exposure at baseline was 92.1 μg/m3 (interquartile range, 87.6–95.7) and 82.4 μg/m3 (interquartile range, 68.4–107.0), respectively.
- We observed higher average systolic BP (1.77 mm Hg [95% CI, 0.97–2.56] and 3.33 mm Hg [95% CI, 1.12–5.52]) per interquartile range differences in monthly and annual exposures, respectively, after adjusting for covariates.
- Interquartile range differences in long-term exposures of 1, 1.5, and 2 years increased the risk of incident hypertension by 1.53× (95% CI, 1.19–1.96), 1.59× (95% CI, 1.31–1.92), and 1.16× (95% CI, 0.95–1.43), respectively.
- Observed effects were larger in individuals with higher waist-hip ratios.
Daily nonaccidental mortality associated with short-term PM 2.5 exposures in Delhi, India
Key findings
- Median exposures to PM2.5 were 91.1 µg/m3 (interquartile range = 68.9, 126.2)
- Total nonaccidental deaths recorded in Delhi during the study period were 700,512. Each 25 µg/m3 increment in exposure was associated with a 0.8% (95% confidence intervals [CI] = 0.3, 1.3%) increase in daily nonaccidental mortality in the study population and a 1.5% (95% CI = 0.8, 2.2%) increase in mortality among those with 60 years of age or over.
- The exposure-response relationship was nonlinear in nature, with relative risk rising rapidly before tapering off above 125 µg/m3.
- Meeting WHO guidelines for acceptable levels of exposure over the study period would have likely averted 17,526 (95% CI = 6,837, 25,589) premature deaths, with older and male populations disproportionately affected.